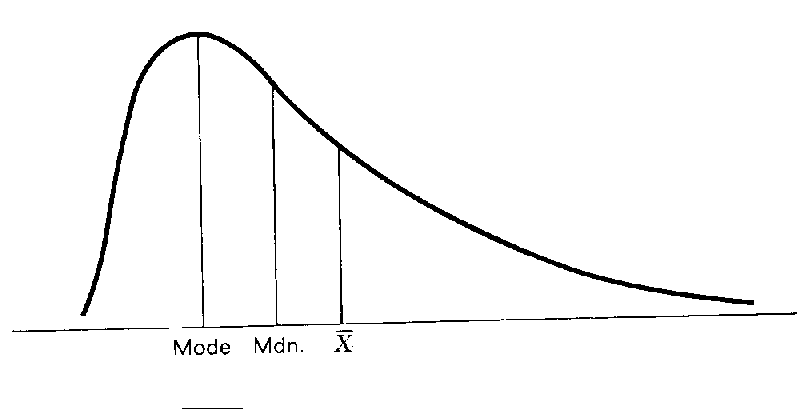
DIAGRAM WHEN THE DATA IS SKEWED, THE 3 MEASURES CANNOT COINCIDE
Z SCORES

Data with different values are better compared by converting to a common measure. The common measure used is the distance from the mean in terms of standard deviation. This is done by way of "Z" scores. Each value is converted to standard deviations with the following formula:

	Z = (X-AVG)/STD

	Where:

	X = the data to be converted
	AVG = mean for the data group
	STD = standard deviation for the data group

The Z scores for the Summerton data are:

TABLE

		DATA							Z SCORES

		250								-1.071
		300								-0.913
		350								-0.755
		350								-0.755
		400								-0.597
		400								-0.597
		400								-0.597
		450								-0.440
		450								-0.440
		450								-0.440
		500								-0.282
		500								-0.282
		600								  0.033
		650								  0.191
		700								  0.349
		750								  0.507
		1000								 1.295
		1200								  1.926
		1500								  2.873


Z scores can be used to directly compare two sets of data even though there may be differences
in magnitude between the two. They will be used to transform raw data in subsequent statistical