THE T DISTRIBUTION
"t" DISTRIBUTION
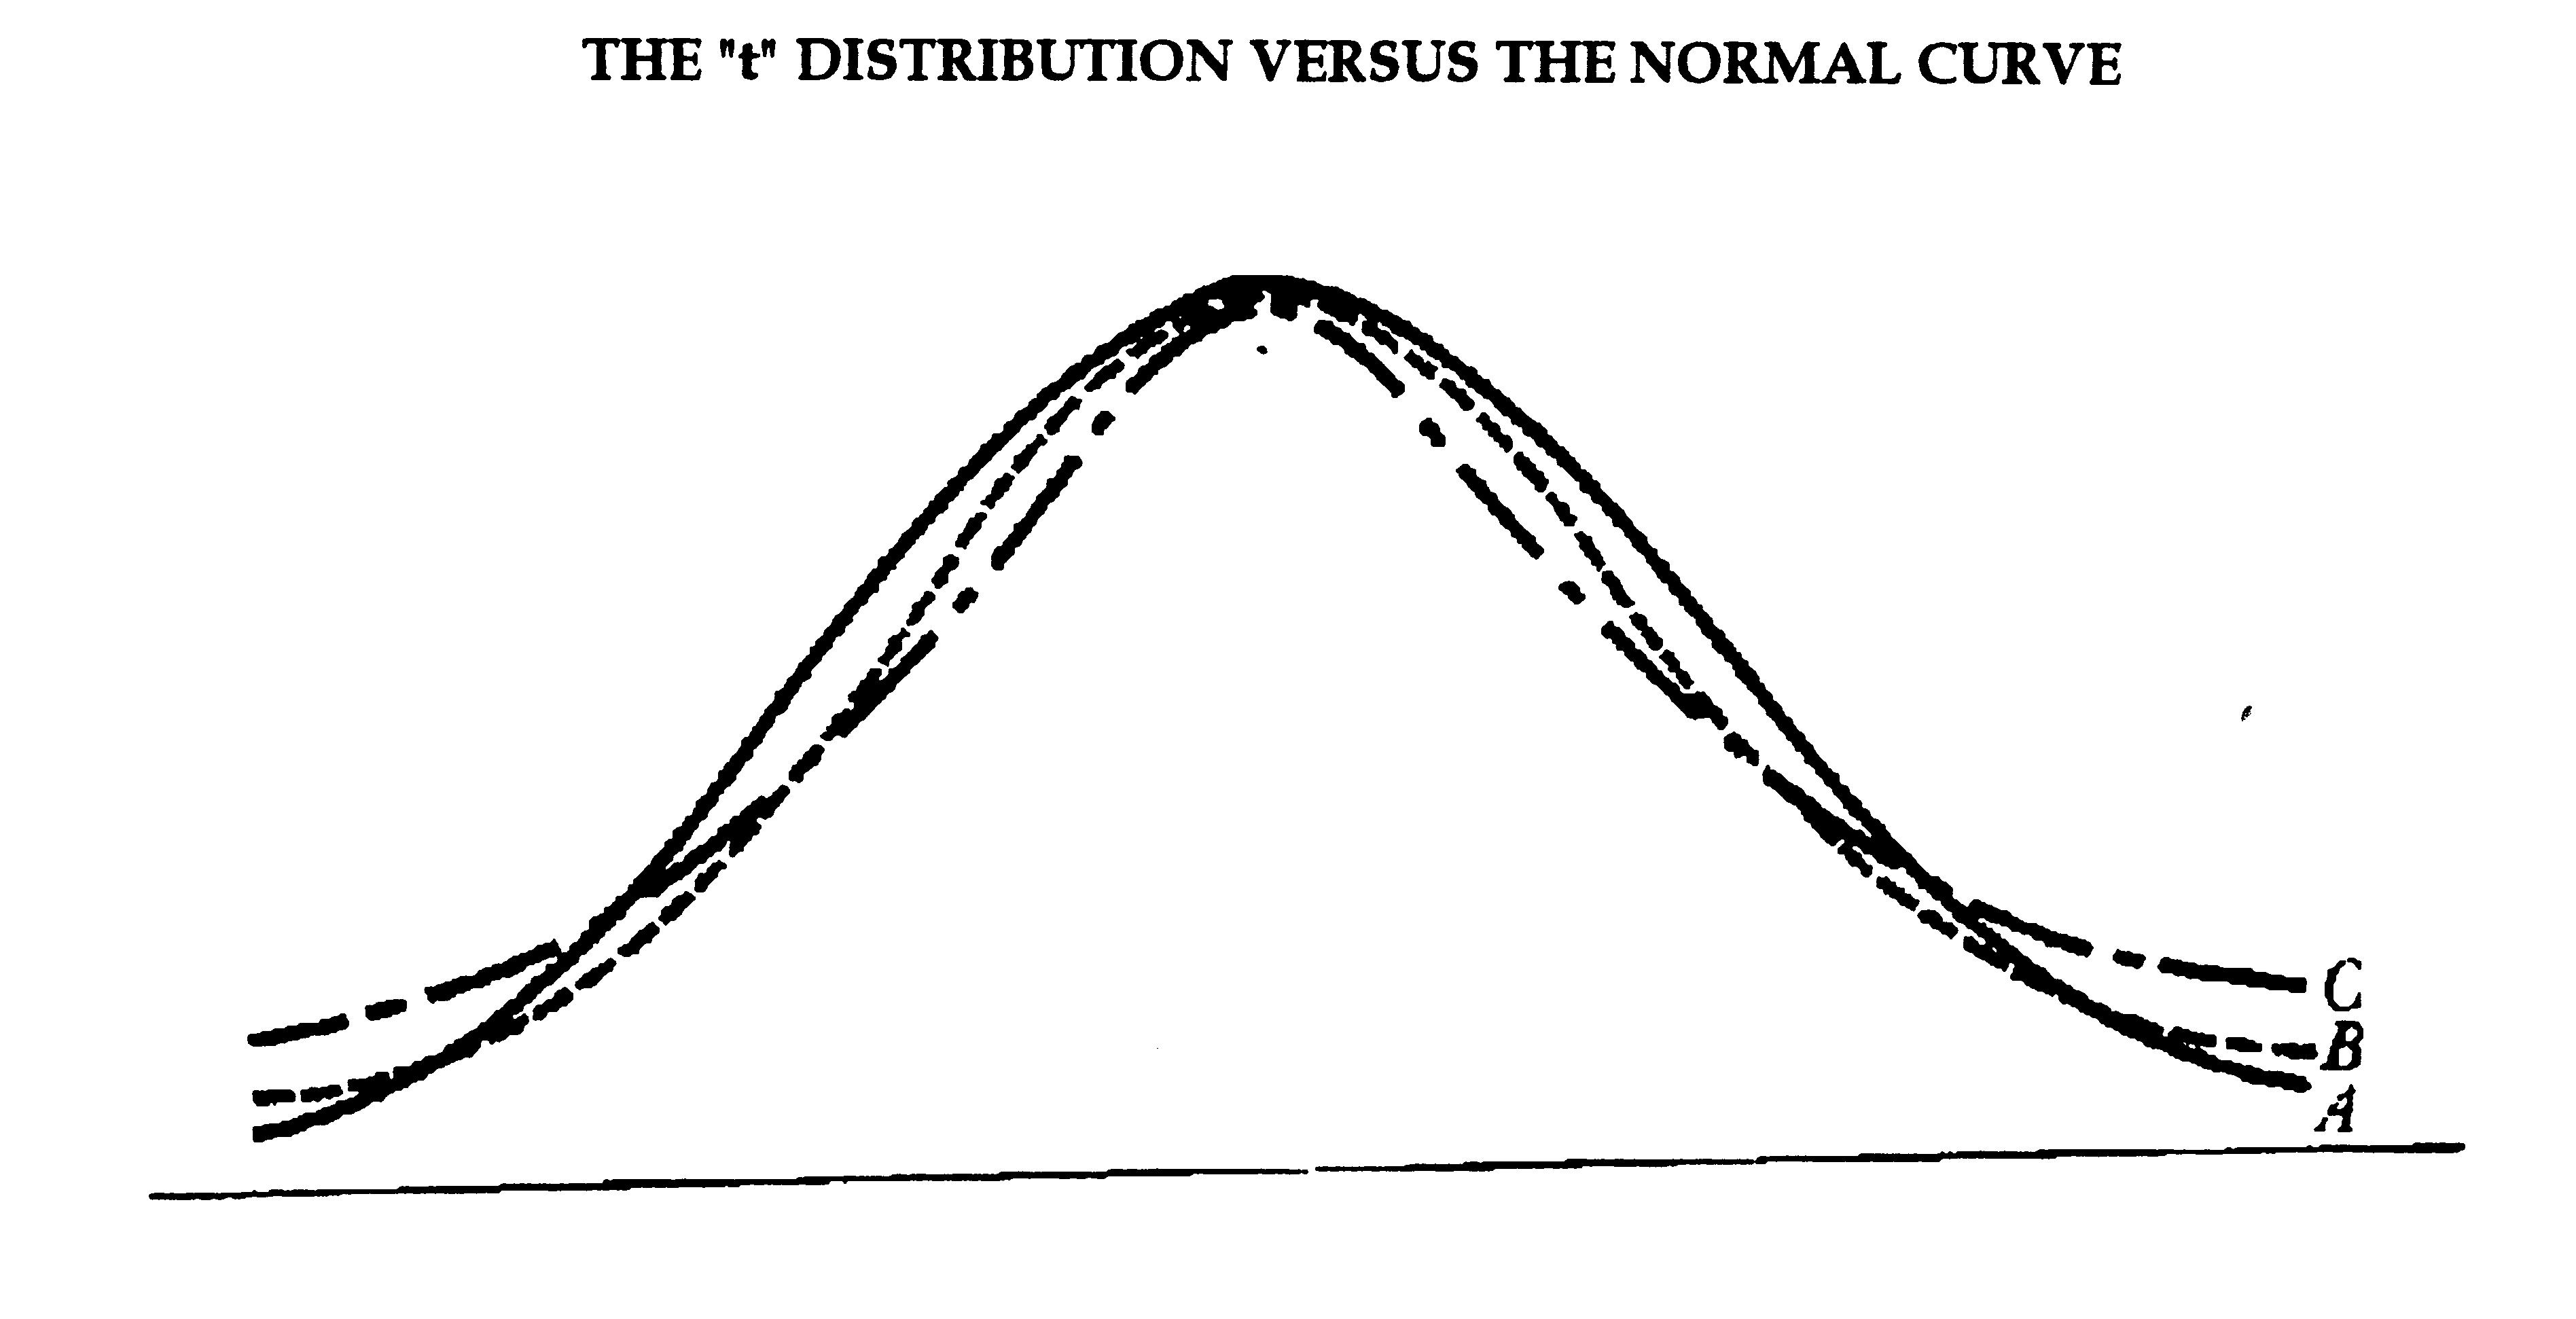
As sample sizes decrease the sampling distribution of their means becomes more pointed in the middle and has relatively more area in their tails. Such a distribution is known as the "t" distribution or "students" distribution. The diagram below compares the normal curve A with two "t" distributions, B and C:
THE "t" DISTRIBUTION VERSUS THE NORMAL CURVE