PIGS

In 1990/91 the Australian pig industry produced about $600 m at the farmgate. It exhibits firm growth in demand for its products in Australia and overseas. Historically, pigs were reared as an adjunct to dairy farming. However, intensive farming, environmental reasons and health concerns have led to a change in the dietary feeding of pigs so that today, most piggeries are located within the grain belt. The industry has also become more specialised to meet the specialised market requirements.

For example, one millimetre of fat above the specified level can result in a price penalty of as much as 20 cents/kilo. Therefore, there has been a decrease in the number of part time producers with production becoming more concentrated in the hands of specialist large scale producers who can control the genetics and the formulation of feed to produce the type of carcase required by the consumer. That is, the industry has become much more scientific and market orientated.

The size of the pig herd has increased relatively slowly in recent times. Sow numbers illustrate this, growing from 301 000 in 1978 to 363 000 in 1990, an increase of about 20% (ABARE). However, the production of pigmeat has shown a significant increase. Fresh pork production in the last 10 years has risen strongly by 63% from 83 000 tonnes in 1980 to 135 000 tonnes in 1990, and bacon and ham production has expanded from 148 000 tonnes to 174 000 tonnes in the same period. The large increase in production reflects the improvement in genetics, new technology and an increasing demand for whitemeat which includes pigmeat products (Australians consume more pigmeat lamb).

The increase in industry efficiency is shown by the number of pig slaughterings which has increased from 4.1m in 1980/81 to 5.1m in 1989/90 while average carcase weight rose from 55.6 kg to 60.7 kg (ABARE).

Consumption in 1990 showed the total meat consumption of Australians was 103.9 kg per person/per annum. This consisted of 17% pigmeat, 37% beef and veal, 22% lamb and mutton and 22% poultry (ABARE). There has been a steady increase in pork consumption in the 1980s from 14.8 kg/person in 1982 to 18.3 kg/person in 1990. Currently, the per capita consumption of bacon and ham is 58% of the total pigmeat consumption the remainder being pork and pork based products (ABARE).

PRODUCERS

The number of piggeries has shown a steady decline over recent years while the number of pigs has remained steady. In 1960 there were about 50 000 piggeries whereas in 1990 there were only about 8 000. This trend is even more marked when comparing the number of sows per piggery. In 1960 the average number of sows per piggery was 29 while in 1990 it was 370.

The trend has been towards very large units which are able to enjoy economies of scale and towards vertically integrated companies with sizes ranging from 500 to more than 20 000 sows. Such agribusinesses account for about 31% of the total sow population and are capital intensive. For example, even a 100 sow piggery requires a capital investment of about $1 000 000.

ASSESSING A PIGGERY'S VIABILITY

The profitability of a piggery is influenced by the number of market weight pigs sold per sow per year, and the growth rate of those pigs. The number of pigs produced per sow in a twelve month period will depend on how many litters she has and how many piglets are born in each litter. The average number of litters produced by sows in NSW and Victoria in 1989 was 2.14 while the average litter size born alive was 10.1.

Therefore, the average number of piglets produced per sow in 1989 was 21.63. However, it only takes a small change in the number of litters produced annually, to substantially change the total number of piglets born alive. If the sow's farrowing rate is lifted to 2.3 litters per year, and maintaining the litter average at 10.1, the total number of piglets born is increased to 23.2.

PIG NUMBERS, 1987 TO 1989 ('000) AUSTRALIA _ 1989
 
1987 1988 
1989 NSW VIC QLD 
SA WA TAS NT
Boars
23
23
22
7
4
5
3
3
-
-
Breeding sows
296
303
295
97
48
67
47
31
5
-
Gilts intended  for breeding 45
46
44
16
8
9
6
5
1 -
Other pigs (incl. suckers, weaners,  growers, etc.) 2247
2333
2310
735
364
532
393
246 39 2
TOTAL PIGS
2611
2706
2671
855
423
611
450
285
45
3


GROWTH RATE

The profitability of a piggery also depends on how quickly the pigs grow because the quicker they grow, the less food is consumed. A pig with a growing rate of 470 g/day will take 191 days to reach a market live weight of 90 kg and a pig growing at 580 g/day will take 155 days to reach the same weight. However, in the process, the latter pig will have eaten 68.4 kg less food. If the food is valued at 27c/kg, the slower pig has eaten an extra $18.50 worth of food and in many cases, this can be half the profit of a 90 kg live weight pig.


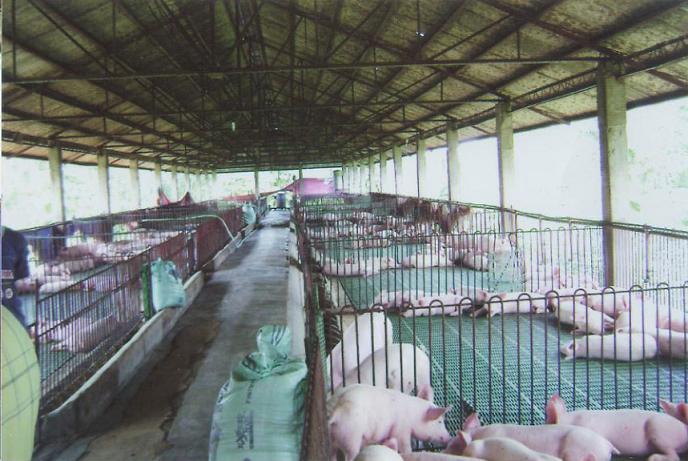
The diagram above shows pens inside a typical piggery.

NUMBERS OF ESTABLISHMENTS WITH AGRICULTURAL ACTIVITY AT 31 MARCH 1987 TO 1989

1987
1988
1989
NSW
VIC
QLD
SA
WA
TAS
NT
ACT
Boars
6866
6531
5900
1890
767
1279
1026
799
130 9 -
Breeding sows
7290
6969
6328
2062
808
1366
1080
859
143
9 1
Gilts intended for breeding
3360
3199
2882
844
394
698
521
365 57
3
-
Other pigs (incl. suckers, weaners,
growers, etc)
7921
7733
7121
2227
961
1585
1240
925
175  8 -
Total pigs
8524
8239 7593
2395
1037
1670
1293
996 
191 10
 1
(ABARE)

MARKETING AND CLASSIFICATION

Marketing methods for the pig industry have undergone major changes in the last decade. More than 95% of the pigs marketed today are sold direct to a processor either by direct consignment or by computer selling. While marketing methods vary slightly from state to state, the basis of trading now relies on a grid system of selling.

With the advancement of technology, equipment that is cost effective is available to the abattoir industry to measure backfat on a carcase. The industry has agreed on carcase classification, with agreement on sites to be measured, optimum weight grades and monitoring procedures for both backfat testing and the weighing of the carcase.

However, it is still accepted that the best single indication of the lean meat content of a carcase is the depth of fat over the 'eye' muscle in the region of the last rib.


PIG HERD PERFORMANCE LEVEL  NSW AND VICTORIA


NSW
VICTORIA
Performance Indicator  
1984-85 1988-89 1985 1989
Piglets born alive
9.75
9.92
9.9
10.3
Stillborn (%)
6.35
6.84
na
na
Preweaning Mortalities(%)
11.80
13.9
14.1
16.2
Overlaid (%)
6.33
7.4
na na
No. litters per sow pa.
2.06
2.12
2.03 2.17
No. piglets weaned/ litter
8.46
8.75
8.6
8.6
Daily Growth rate (g/day)
464
529
na
na
No. pigs sold per sow pa.
14.7
14.45 na
na
Sources • Piggybank Annual Reports - NSW Agriculture & Fisheries
Department of Agriculture & Rural Affairs, Victoria

A number of changes have been made over the last few years in regard to the classification grid. The new grid more accurately reflects the current trend towards leaner carcases for both fresh pork and curing trades. All sectors of the pig industry in Australia have ratified a new standard carcase definition.

It enables producers throughout Australia to have a standard by which to compare prices and carcase weights when marketing slaughter pigs. Irrespective of what slaughter trim is used at any AUSMEAT accredited abattoir, carcase weights are converted to the equivalent of the new standard carcase definition for pricing feedback to producers.

INDUSTRY STRUCTURE

AUSTRALIAN PORK PRODUCERS' FEDERATION (APPF)

In most instances, individual pork producers are represented on their State industry organisation by delegates elected from local districts. The APPF is the representative body of the industry at national level. The APPF selects delegates to represent pork producers on
appropriate industry authorities.

The Federal Government administers and distributes all levies as deducted and collected by abattoirs/processors at point of slaughter. In 1990, allocation of slaughter levies was 40c/pig to research and $1.50/pig to the Australian Pork Corporation. Out of this $1.50, the APC has to fund its own administration, all costs incurred by the Selection Committee and promotional activities. For research, the Federal Government matches the producers' levies on a dollar-for dollar basis.

The legislative structure now involves other organisations which are allied to the pork industry. No allowance has been made in the legislation for future funding by other pork industry representative bodies involved in the decision making process.

AUSTRALIAN PORK CORPORATION

The Australian Pork Corporation's principal mission is to enhance commercial returns to all sectors of the pig industry. To this end Corporation has concentrated on presenting pork and pork products as a preferred food for all eating occasions. The main focus is the production, processing, packaging and promotion of quality products in response to identified consumer demand. The Corporation was established on 1 July, 1987 (gazetted on the 1st August 1988) and
operates under three Acts Parliament:

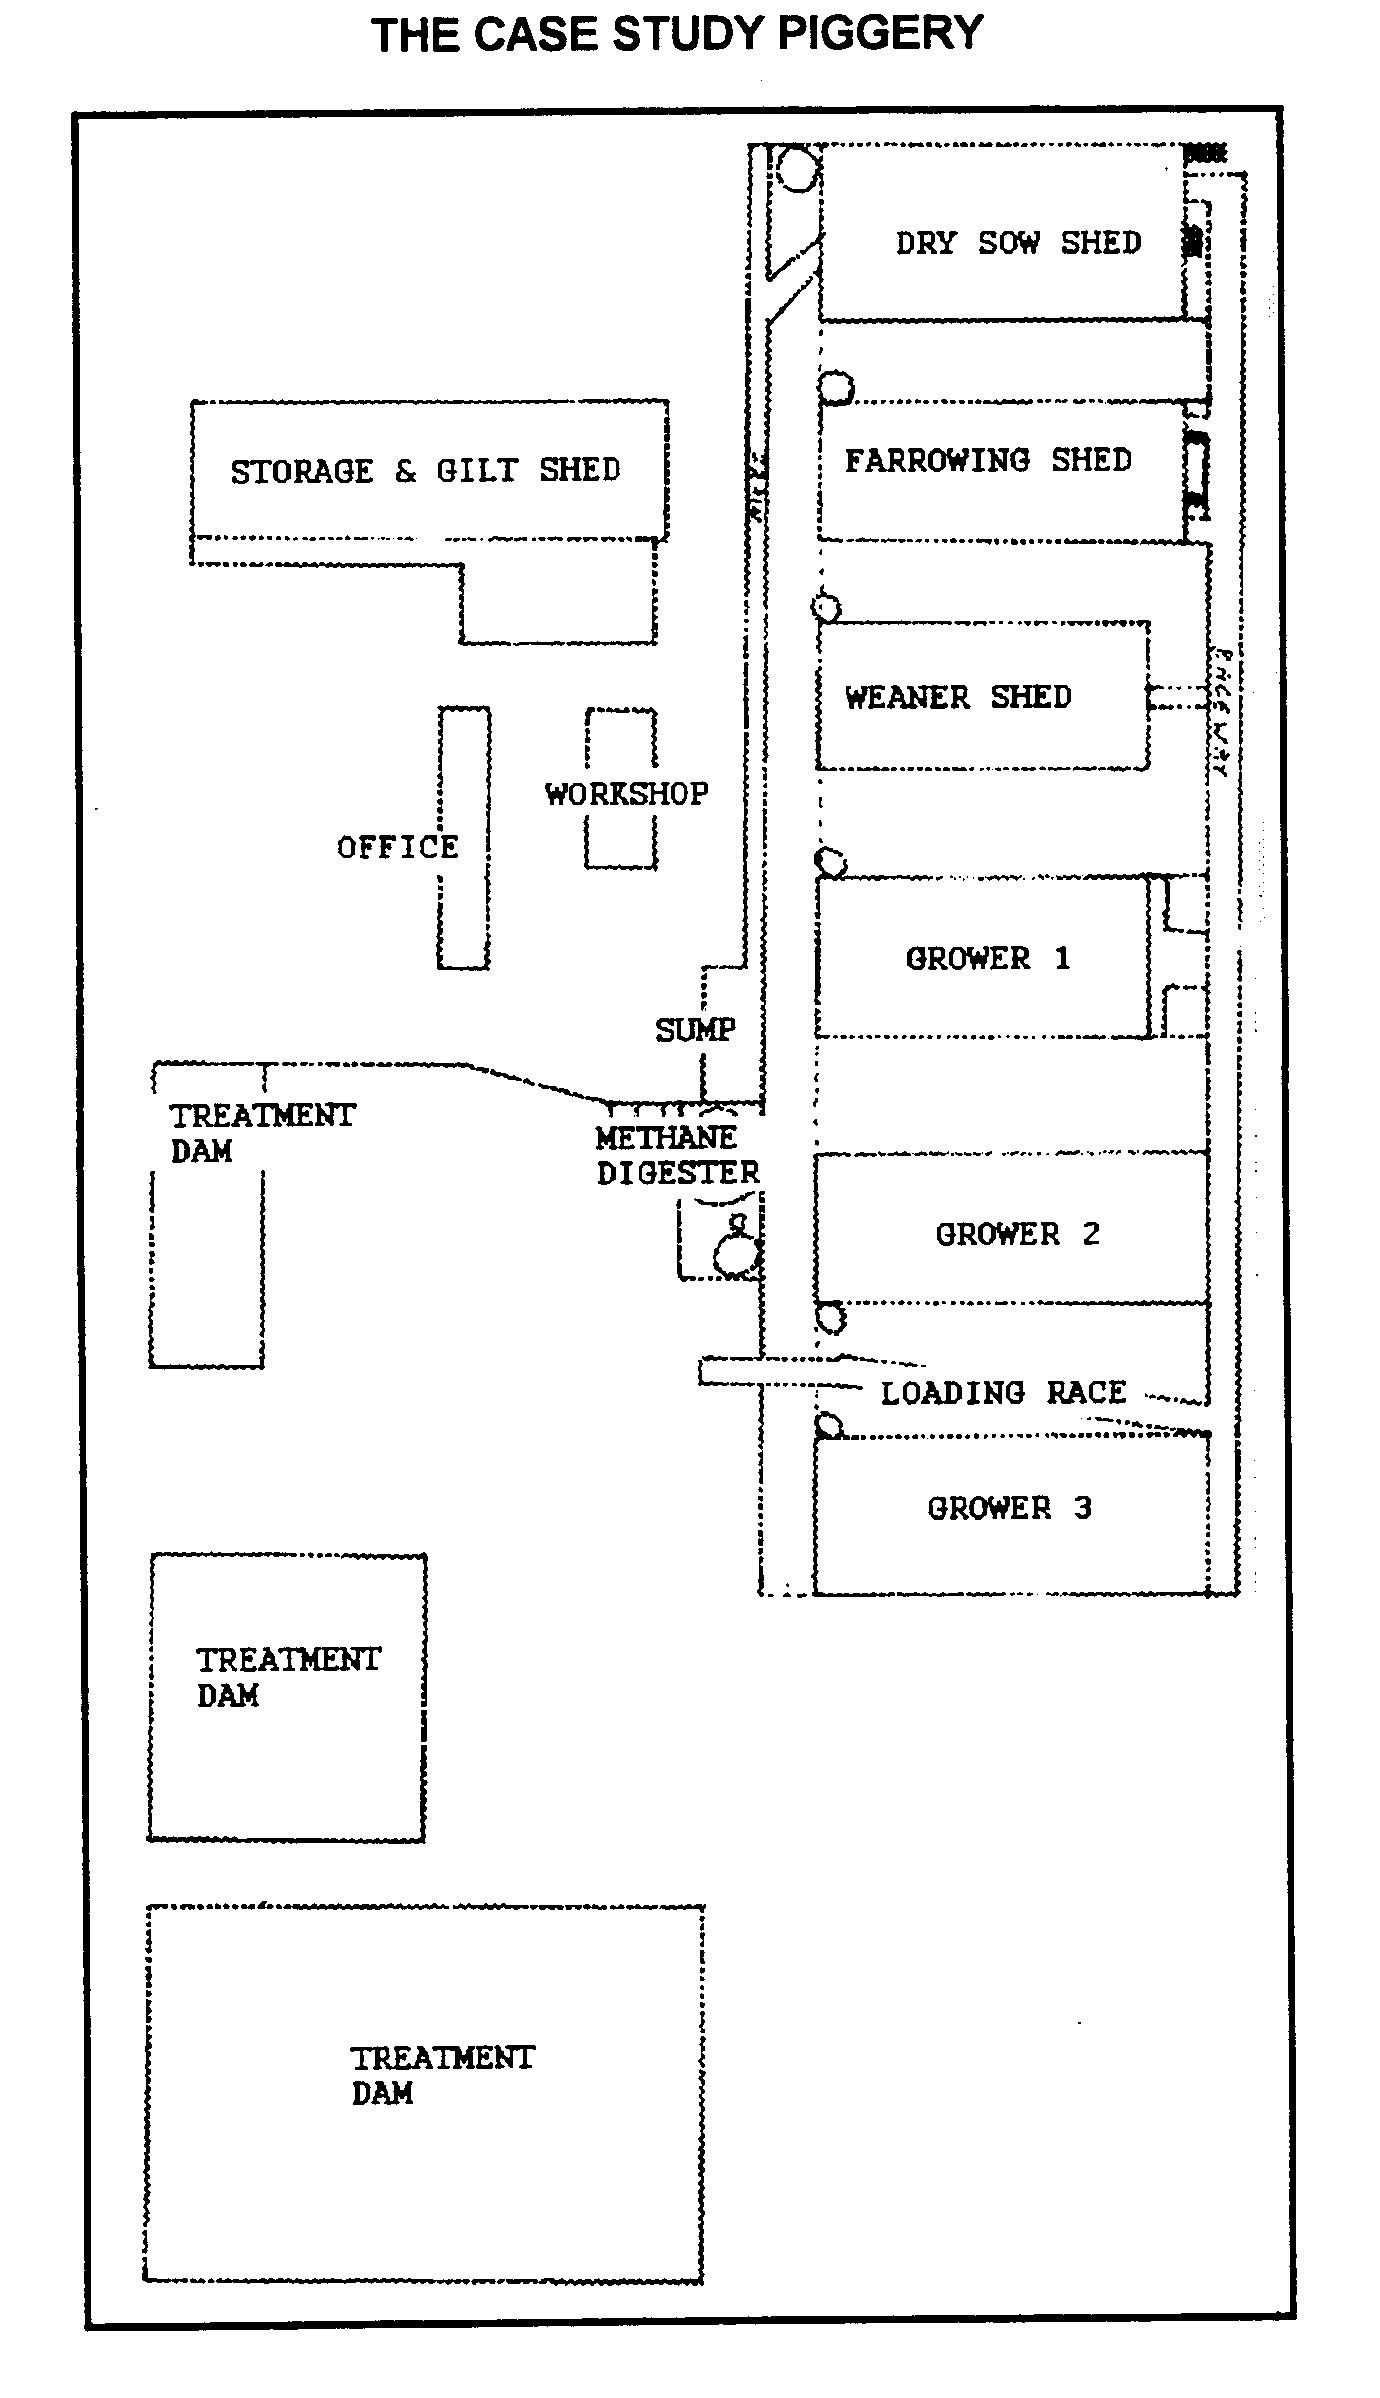
PIGGERY CASE STUDY

The following comments and description apply to a small piggery of about 100 pigs. Breeding groups of Large White and Landrace pigs were established in 1967/68 and in the early stages there was not much emphasis on stud breeding. Over the last 20 years there has been an increasing shift towards commercial production of crossbred sows and the selection of breeding animals has included the measurement of back fat thickness, growth rate and the estimation of sow fecundity. The cessation of stud registration several years ago was simply a continuation of the trend towards commercial production. In 1982 the dry sow shed was built and the piggery became a totally intensive enterprise.

THE CURRENT HERD

Most replacement gilts have been bought from studs and breeding companies in recent years. Stock consists of Large White, Landrace and Hampshire crossbreds. The herd currently has 54% bought in Large White/Landrace sows, 37% homebred hybrid sows and 9% bought in hybrid boars. The current numbers are 100 sows and 6 boars.

HOUSING

Dry sow shed, gilt shed, farrowing shed, weaner shed and 3 grower sheds. See diagram below:


LABOUR

1 full time enterprise manager and 0.8 time farmhand.

PERFORMANCE INDICATORS

The following are target performance indicators applicable to a well managed and efficient piggery. The valuer can use such indicators to assess the level of management and viability of a piggery to be valued (also see the performance indicators for Victoria and NSW above):


DAILY ROUTINE

The following is a summary of a typical day in the case study piggery:

Feed pigs
Check that feeders are full
Hose out farrowing shed
Teeth, tail, iron, weigh and ear notch any new litters
Mate when necessary
Sweep grower shed and dry sow shed aisles
Hose out gilt shed drain.

WEEKLY ROUTINE

MONDAY: Hose out weaner shed, move stock Grower 1 to Grower 2, clean
pens in grower 1, matings and pregnancy testing.
TUESDAY: Matings, move stock Grower 3 to Grower 1, backfat and growth rate
testing of market pigs, clean Grower 3.
WEDNESDAY: Mating, move stock weaner to Grower 3, clean out weaner kennels.
THURSDAY: Process litters, weaning of suckers, move sows out into dry sow
shed, clean out farrowing crates.
FRIDAY: Process litters, move sows into crates, hose out dry sow shed and
gilt shed, prepare for weekend.
SATURDAY AND SUNDAY: Feed pigs, process litters and matings if necessary.


10