OATS
Oats
are traditionally grown in moist, temperate regions. However,
improved varieties and management practices have enabled oats to be
grown over a wider range of soil and climatic conditions. They have a
high feed value and produce a greater bulk of growth than other
winter cereals; they need less cultivation and respond well to
superphosphate and nitrogen.
Oats
have two main uses: as a grain crop, and as a fodder crop (following
sowing, fallow or rough sowing into stubble or clover pastures).
Fodder crops can either be grazed and then harvested for grain after
removal of livestock, or else mown and baled or cut for chaff.
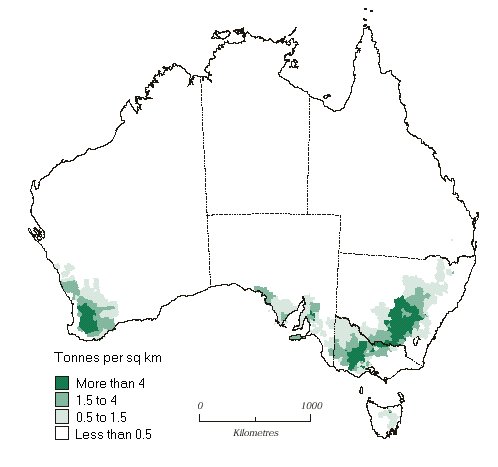
THE
PRODUCTION OF OATS FOR GRAIN IN AUSTRALIA IN 1996-97.
Production
of oats fell by 38% to 1.1 million tonnes in 1999-2000, with falls
recorded in all States. The largest falls in production were recorded
in New South Wales (down by 58% to 284,000 tonnes) and Victoria (down
by 35% to 296,000 tonnes), leaving Western Australia as the main
producing State with a harvest of 439,000 tonnes.
The
majority of Australian oats harvested for grain is used domestically
for stock feed purposes. A small proportion of high quality grain is
used for human consumption. A small proportion of grain production is
exported for human consumption.
After
three years of low plantings, the total area of oats planted in
2002-03 increased by 16% to 911,000 ha (table 14.16) as growers
anticipated increased demand and prices for oat grain, especially for
stockfeed. Due to the dry conditions production fell by 33% to
957,000 tonnes, the lowest level recorded since 1995. Production in
Western Australia was less affected than other states, with a 14%
drop in production. The Western Australian crop of 477,000 tonnes
represented just under 50% of the national harvest.
OATS
FOR GRAIN, AREA AND PRODUCTION
AREA
('000 ha.)
YEAR
|
NSW
|
VIC
|
QLD
|
SA
|
WA
|
TAS
|
AUST |
1994-95
|
375
|
148
|
14
|
95
|
256 |
8
|
897 |
1995-96
|
505
|
187
|
14
|
120
|
300
|
10
|
1,136 |
1996-97
|
393
|
175
|
39
|
121
|
316
|
8
|
1,052 |
1997-98
|
325
|
172
|
16
|
111
|
305
|
8
|
937 |
1998-99
|
354
|
188
|
18
|
112
|
228
|
8
|
909 |
1999-00
|
160
|
138
|
10
|
70
|
199
|
6 |
584 |
2000-01
|
168
|
140
|
13
|
75
|
248
|
7
|
650 |
2001-02
|
231 1 |
42
|
^11
|
^108
|
287
|
6
|
784 |
2002-03
|
308
|
188
|
^9
|
88
|
314
|
4
|
911 |
| PRODUCTION
('000 t) |
|
|
|
|
|
|
|
1994-95
|
197
|
201
|
3
|
87
|
425
|
11
|
924 |
1995-96
|
711
|
392
|
7
|
162
|
585
|
18
|
1,875 |
1996-97
|
607
|
304
|
26
|
156
|
546
|
14 |
1,653 |
1997-98
|
488
|
369
|
13
|
153
|
596
|
15
|
1,634 |
1998-99
|
669
|
458
|
15
|
178
|
463
|
14
|
1,798 |
1999-00
|
284
|
296 |
12
|
78
|
439
|
10
|
1,118 |
2000-01
|
246
|
351
|
6
|
117
|
317
|
13
|
1,050 |
2001-02
|
320
|
334
|
^7
|
^203
|
557
|
12
|
1,434 |
2002-03
|
149
|
250
|
^4
|
70
|
477
|
7
|
9 |
Source:
Agricultural Commodities, Australia (7121.0).