MARKET
PRICE
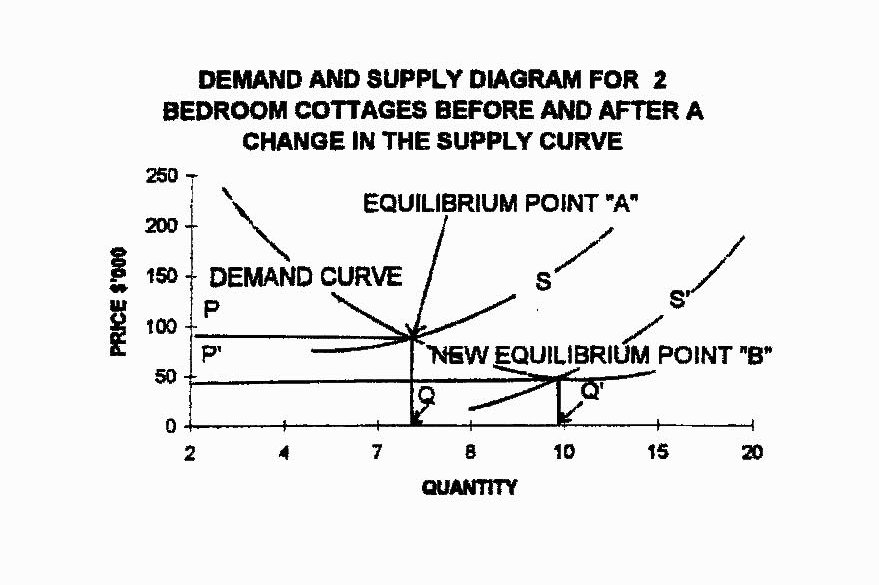
The
diagram below shows a typical supply and demand diagram illustrating
the interplay of demand and supply forces for a typical house market
(2 bedroom houses). Price and quantity purchased are determined at
the point where the supply curve and demand curve intersect at “A”.
Price
P and quantity Q at this point are called the equilibrium price
and equilibrium quantity respectively. At price P, the
quantity of 2 bedroom houses offered for sale (supplied) and the
amount of such houses purchased (demanded) are equal.
DEMAND
& SUPPLY FOR 2 BEDROOM HOUSES
Any
movement away from the equilibrium price would be resisted by the
automatic workings of the market place.
EXAMPLE
If
the price was raised, the amount demanded would fall and vice versa.
This would not be a stable situation as for example, the "glut"
or oversupply would force to lower their prices to move stock until
price P was established.
The
equilibrium price changes whenever the factors affecting supply or
demand change. For example, the diagram also illustrates the effect
of an increase in supply.
New
production techniques or a decrease in interest rates make it cheaper
to buy a house. As a result, producers are willing to supply a larger
number of houses at each price resulting in a new supply curve; “S’”
and causing a new equilibrium point “B”.
In
an unchanging world of perfect knowledge the price corresponding to
the intersection of supply and demand would be established quickly
and would be stable. The price is in equilibrium because the forces
are in balance. However, in property markets the nonprice
determinants of demand change frequently thereby, causing shifts in
the demand curve. Prices and quantities sold are seldom stable for
long and therefore, equilibrium does not remain long and is
constantly changing. That is, the curves are more representative of a
dynamic steady state market than a slow moving fixed market.
2