FARM PERFORMANCE
The following are some of the major influences on farm performance today:
These are major influences on farm performance in the 1990s. The decade commenced with a fall in wool prices. Wheat prices rose sharply in the middle of the decade. For farmers with arable land, the signal was to expand grain cropping, which many did. There are signs, however, that the relatively high returns for cropping may soon come under pressure from falling world (US dollar denominated) wheat prices. At the same time, wool prices have begun to rise.
In addition to pressures from fluctuating commodity prices, farmers have also faced rising input costs. The index of prices paid by farmers for inputs, including capital items, fuel, fertiliser and chemicals, has increased by more than 10 per cent since the beginning of the 1990s. The declining value of the Australian dollar has contributed to this increase in costs, with many inputs used in the production of agricultural commodities imported from overseas.
Dry conditions regularly affect Australian crop production. But, the effect of the prolonged dry conditions experienced in parts of Queensland through the 1990s is particularly noticeable as well as a more general drought in 2001/2. From 1991 92 to I 1996 97, for example, annual wheat production in Queensland was never more than about a third of the quantity produced 1 in 1990 91.
ADJUSTING TO THESE PRESSURES
Australian farming has adjusted to these pressures, with adjustment taking many forms. On the farm, adjustments have been made to both the farming activities undertaken and the intensity of those activities. At the sector level, average farm sizes have increased and the number of agricultural establishments has continued to decline. The changes that occurred over the past decade in the farming sector have also had a flow on effect on rural towns, whose economies are often highly dependent on the performance of agricultural industries.
In response to changing relative commodity prices, there has been considerable adjustment to the mix of activities undertaken on farms. Declining wool prices throughout the decade led to a move out of wool production. Sheep numbers have fallen by around 30 per cent from 1990 91 levels. In the wheat sheep zone, where farmers have relatively more scope to move between livestock and cropping, there was a significant move into cropping in the 1990s. The value of cereal grains and products produced in Australia increased by nearly 90 per cent in real terms over the decade.
To better manage volatility in commodity markets, the diversity of farm enterprises has also increased. The number of significant enterprises (defined as activities contributing to more than 10% of farm business receipts) on broadacre farms increased from an average of 2.3 per farm in 1990 91 to 2.7 in 1998 99. There was also an increase in the number of crop varieties and breeds of livestock produced for different markets. An example is the growing number of livestock farms in northern Australia that noon produce cattle for both slaughter and live export markets.
Throughout the 1990s the Australian production system became more intensive. Almost all of the broadacre and dairy industries covered by ABARE's annual surveys were found to have increased their production intensity. In the intensive cropping industries the area of crops being irrigated increased over the decade. The area planted to irrigated rice increased by around a third from 1990 91 levels, while the area of irrigated cotton nearly doubled.
In the livestock industry the number of beef cattle being finished on grain increased over the decade. Despite some annual fluctuations in response to movements in grain prices, the number of beef cattle on feedlots increased substantially during the 1990s, rising from 252 000 in March 1990 to 572 000 in March 2000 (Australian Lot Feeders Association 2000).
Production in the dairy industry has also intensified. In Victoria, Tasmania and South Australia, the proportion of dairy farms using supplementary feed to boost milk production or fill seasonal feed shortages increased from 72% in 1991 92 to 85% in 1997 98.
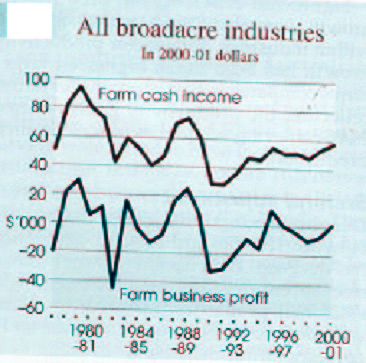
In response to downward pressure on their terms of trade (the ratio of prices received toprices paid), farmers have had to increase productivity to maintain their profitability and international competitiveness. Over the 22 year period to 1998 99 total factor productivity growth in the broadacre sector was around 2.6% a year.
However, this productivity growth was not realised uniformly across industries. The cropping industries appear to have outperformed the livestock industries, with productivity growth on the cropping farms estimated to have been around 3.6% a year over the past two decades. Beef specialists and dairy farmers achieved the next highest productivity gains, with estimated annual growth of around 2.1% and 1.6% respectively. Sheep specialists, however, achieved productivity gains of less than 1% a year over the same period.
Significant differences in productivity growth were also found to have occurred within industries. Total factor productivity growth has been much higher on larger farms compared with that on smaller farms, reflecting the productivity gains realised from achieving economies of scale in their production.
Despite productivity gains, the margin between receipts and costs in agriculture has declined. With declining farm incomes over recent decades, many farmers have sold their properties, resulting in a long term decline in the number of farms and a corresponding increase in average farm size.
The decline in the number of farms, together with improved technology, has led to a reduction in the size of the farm work force. It has also led to an increased dependence on off farm employment. The proportion of broadacre farms obtaining income from off farm wages and salaries increased in the 1990s. Off farm wages and salaries averaged 20 30 per cent of the total income of farm families in the broadacre industries in the years 1993 94 to 1995 96.
The economies of small rural towns in Australia are highly dependent on farm expenditure (Rasheed 2000). Expenditure by farm families in country towns across Australia influence income for nonfarm businesses, employment opportunities for town residents, and opportunities for off farm employment.
Reduced farm incomes and the related limited demand for farm labor have led to the migration of many people of working age from inland and remote areas over the past decade, and to a decline in the towns dependent on agriculture.
At the beginning of the 1990s, the farm sector contributed 3.4% of Australia's gross domestic product. This contribution fell slightly over the decade. The number of people employed in the farm sector has fluctuated around 370 000; as a proportion of total Australian employment, farm employment declined from 5% in 1990 91 to just over 4 per cent in 1999 2000.
Despite fluctuating commodity prices, the value of exports from the farm sector increased significantly over the decade. In 1999 2000, $23 billion worth of agricultural products were exported an increase of just over 50% in real terms since 1990-91. The increase maintained the farm sector's share of merchandise exports at around 25% over the decade.
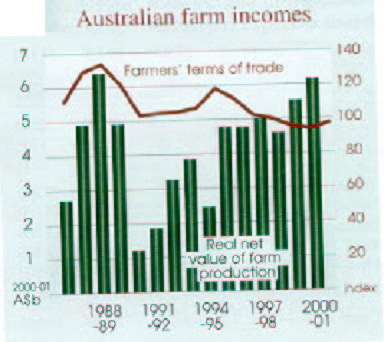
The gross value of farm production is forecast to rise by 5.5% to $32 billion in 2000 01. The main factor underpinning the rise is the increase in wool prices, which is likely to more than offset the effect of lower grain production. Farm costs are forecast to rise by 4% in 2000 01. As a result, the net value of farm production is forecast to rise by 14% to $6.18 billion in 2000 01.
In the agricultural and grazing industries survey, five broadacre industries are distinguished:
wheat and other crops
mixed livestock- crops
sheep
beef
sheep beef.
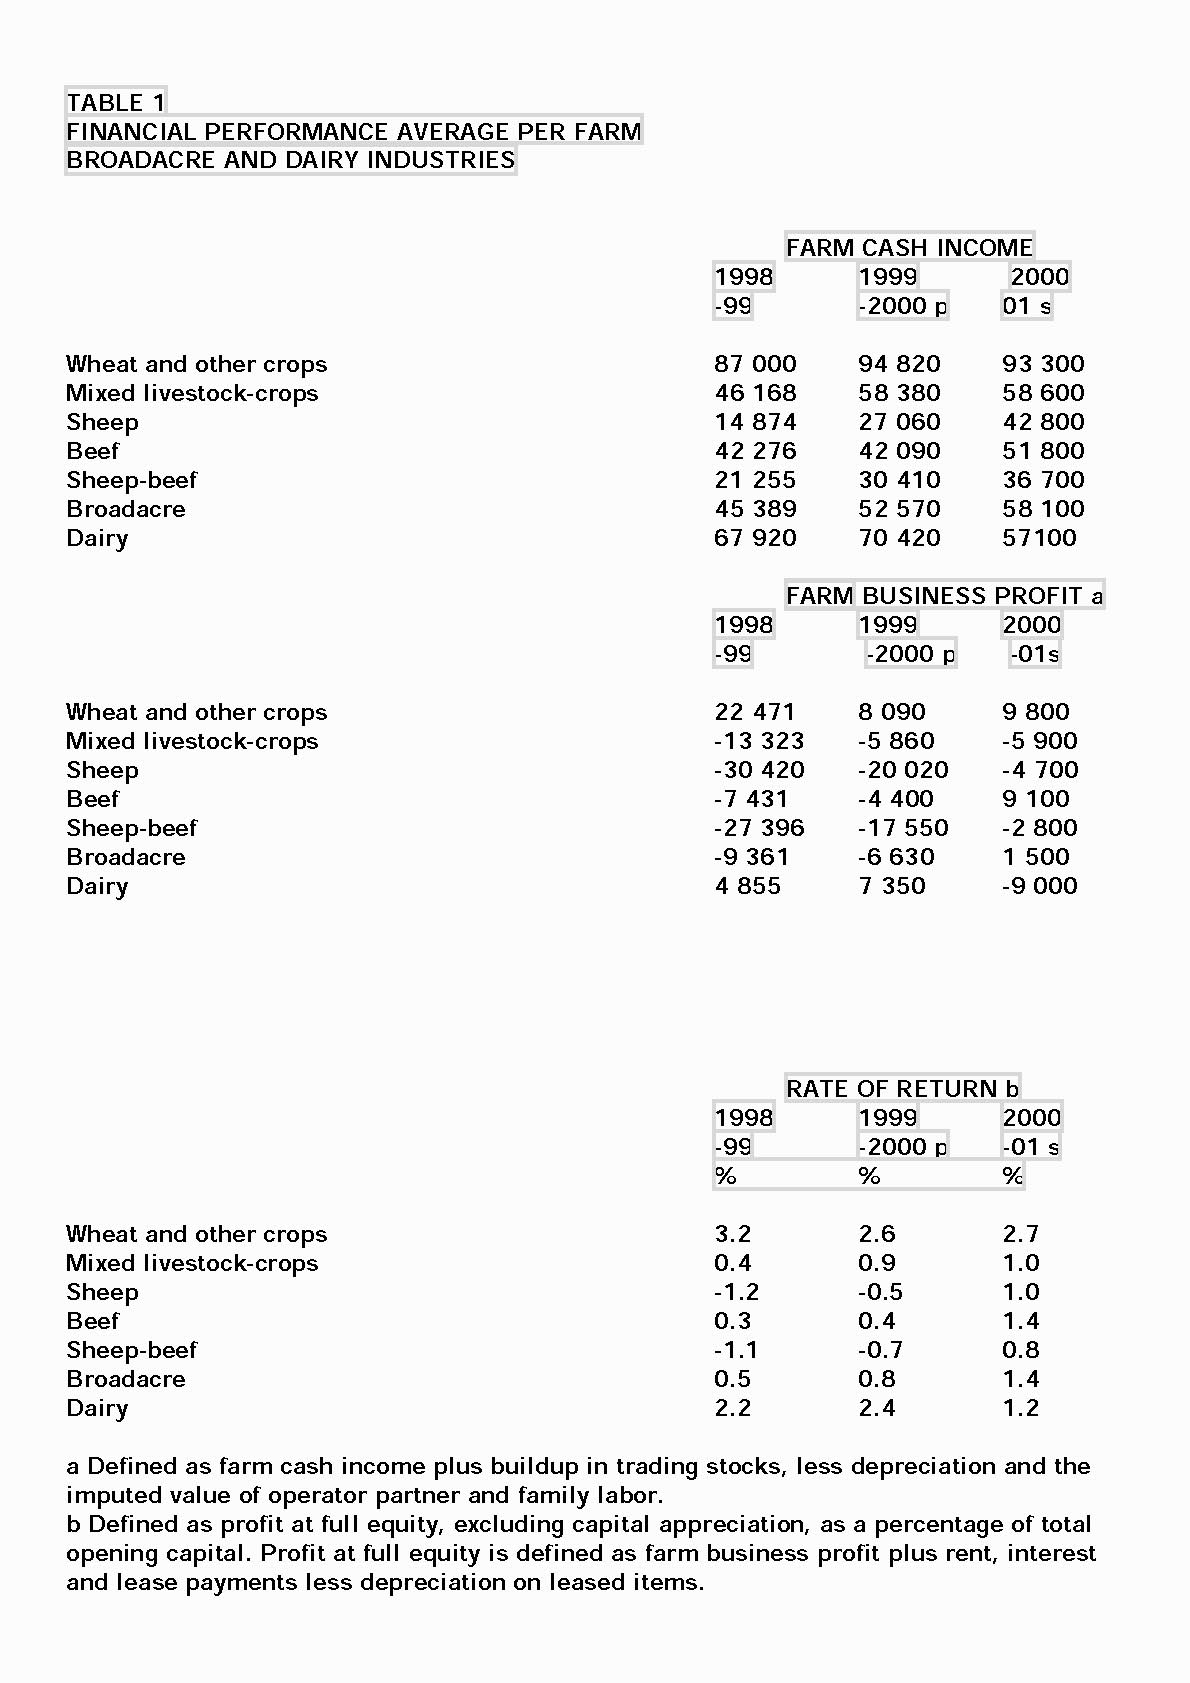
The expected financial performance of the broadacre and dairy industries in 200001 is shown in Table 1. Farm cash income (average per farm) is estimated to rise in the sheep, beef and sheep beef industries, but to fall in the wheat and other crops industry, and the dairy industry.
Overall,
farm cash income for the broadacre industries as a group is expected
to rise by 10% to average $58 100 per farm in 2000 01. The main
factors expected to influence financial performance in 2000 01
are discussed later in the individual industry sections.
In contrast, farm cash income for the dairy industry is expected to fall by 19% to average $57 100 per farm. A more detailed discussion of dairy industry prospects follows the discussion of the individual broadacre industries below. Definitions of the major performance indicators such as farm cash income, farm business profit and rate of return are as follows:
FARM CASH INCOME
Is the surplus farm based income available after paying cash operating costs and interest.
FARM BUSINESS PROFIT refines farm cash income by adding changes in trading stocks and deducting depreciation and an imputed value of family labor.