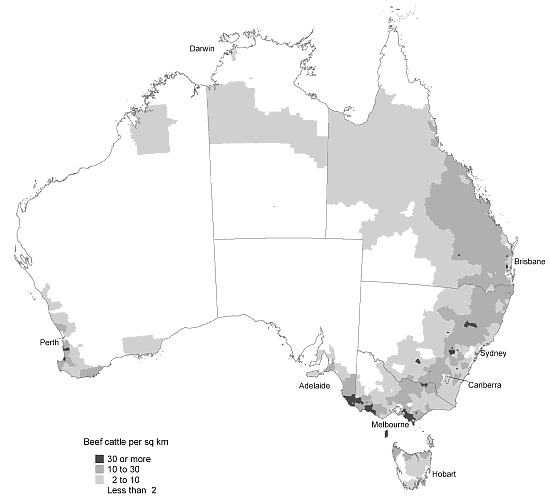
Source: Agricultural Commodities, Australia (7121.0).
| 14.31
CATTLE, By purpose - 30 June
|
|||||||
| |
|
1999(a) | 2000 | 2001 | 2002 | 2003 | 2004 |
| |
|
’000 | ’000 | ’000 | '000 | '000 | '000 |
|
|
|||||||
| Milk cattle | |
|
|
|
|
|
|
| |
Cows (in milk and dry) | 2,155 | 2,171 | 2,176 | 2,123 | 2,050 | 2,038 |
| |
Other milk cattle | 1,065 | 969 | 1,041 | 1,008 | 999 | 1,016 |
| |
Total | 3,220 | 3,140 | 3,217 | 3,131 | 3,049 | 3,055 |
| Meat cattle | |
|
|
|
|
|
|
| |
Bulls and bull calves used or intended for service | 528 | 518 | 591 | 620 | 570 | 617 |
| |
Other calves under one year | 5,740 | 5,872 | 6,083 | 5,679 | 5,292 | 5,260 |
| |
Cows and heifers one year and over | 11,621 | 12,282 | 12,007 | 12,652 | 12,245 | 12,570 |
| |
Other cattle one year and over | 5,469 | 5,774 | 5,823 | 5,788 | 5,508 | 5,964 |
| |
Total | 23,358 | 24,448 | 24,504 | 24,739 | 23,615 | 24,410 |
| Total | 26,578 | 27,588 | 27,722 | 27,870 | 26,664 | 27,465 | |
|
|
|||||||
| (a)
At 31 March. Source: Agricultural Commodities, Australia (7121.0). |
|||||||
| 14.32
CATTLE, By state and territory - 30 June
|
||||||||
| |
NSW | Vic. | Qld | SA | WA | Tas. | NT | Aust.(a) |
| |
’000 | ’000 | ’000 | ’000 | ’000 | ’000 | ’000 | ’000 |
|
|
||||||||
| 1999(b) | 6,291 | 4,125 | 10,748 | 1,183 | 1,931 | 724 | 1,567 | 26,578 |
| 2000 | 5,970 | 4,264 | 11,808 | 1,184 | 2,165 | 617 | 1,571 | 27,588 |
| 2001 | 6,215 | 4,405 | 11,376 | 1,242 | 2,128 | 636 | (c)1,707 | 27,722 |
| 2002 | 6,021 | 4,412 | 11,544 | 1,381 | 2,104 | 619 | (c)1,777 | 27,870 |
| 2003 | 5,817 | 4,388 | 10,740 | 1,401 | 1,945 | 682 | (c)1,683 | 26,664 |
| 2004 | 5,816 | 4,281 | 11,500 | 1,352 | 2,095 | 684 | (d)1,730 | 27,465 |
|
|
||||||||
| (a)
Includes ACT. (b) At 31 March. (c) Excludes dairy cattle. (d) No dairy cattle were recorded in NT. Source: Agricultural Commodities, Australia (7121.0). |
||||||||
