box
plot
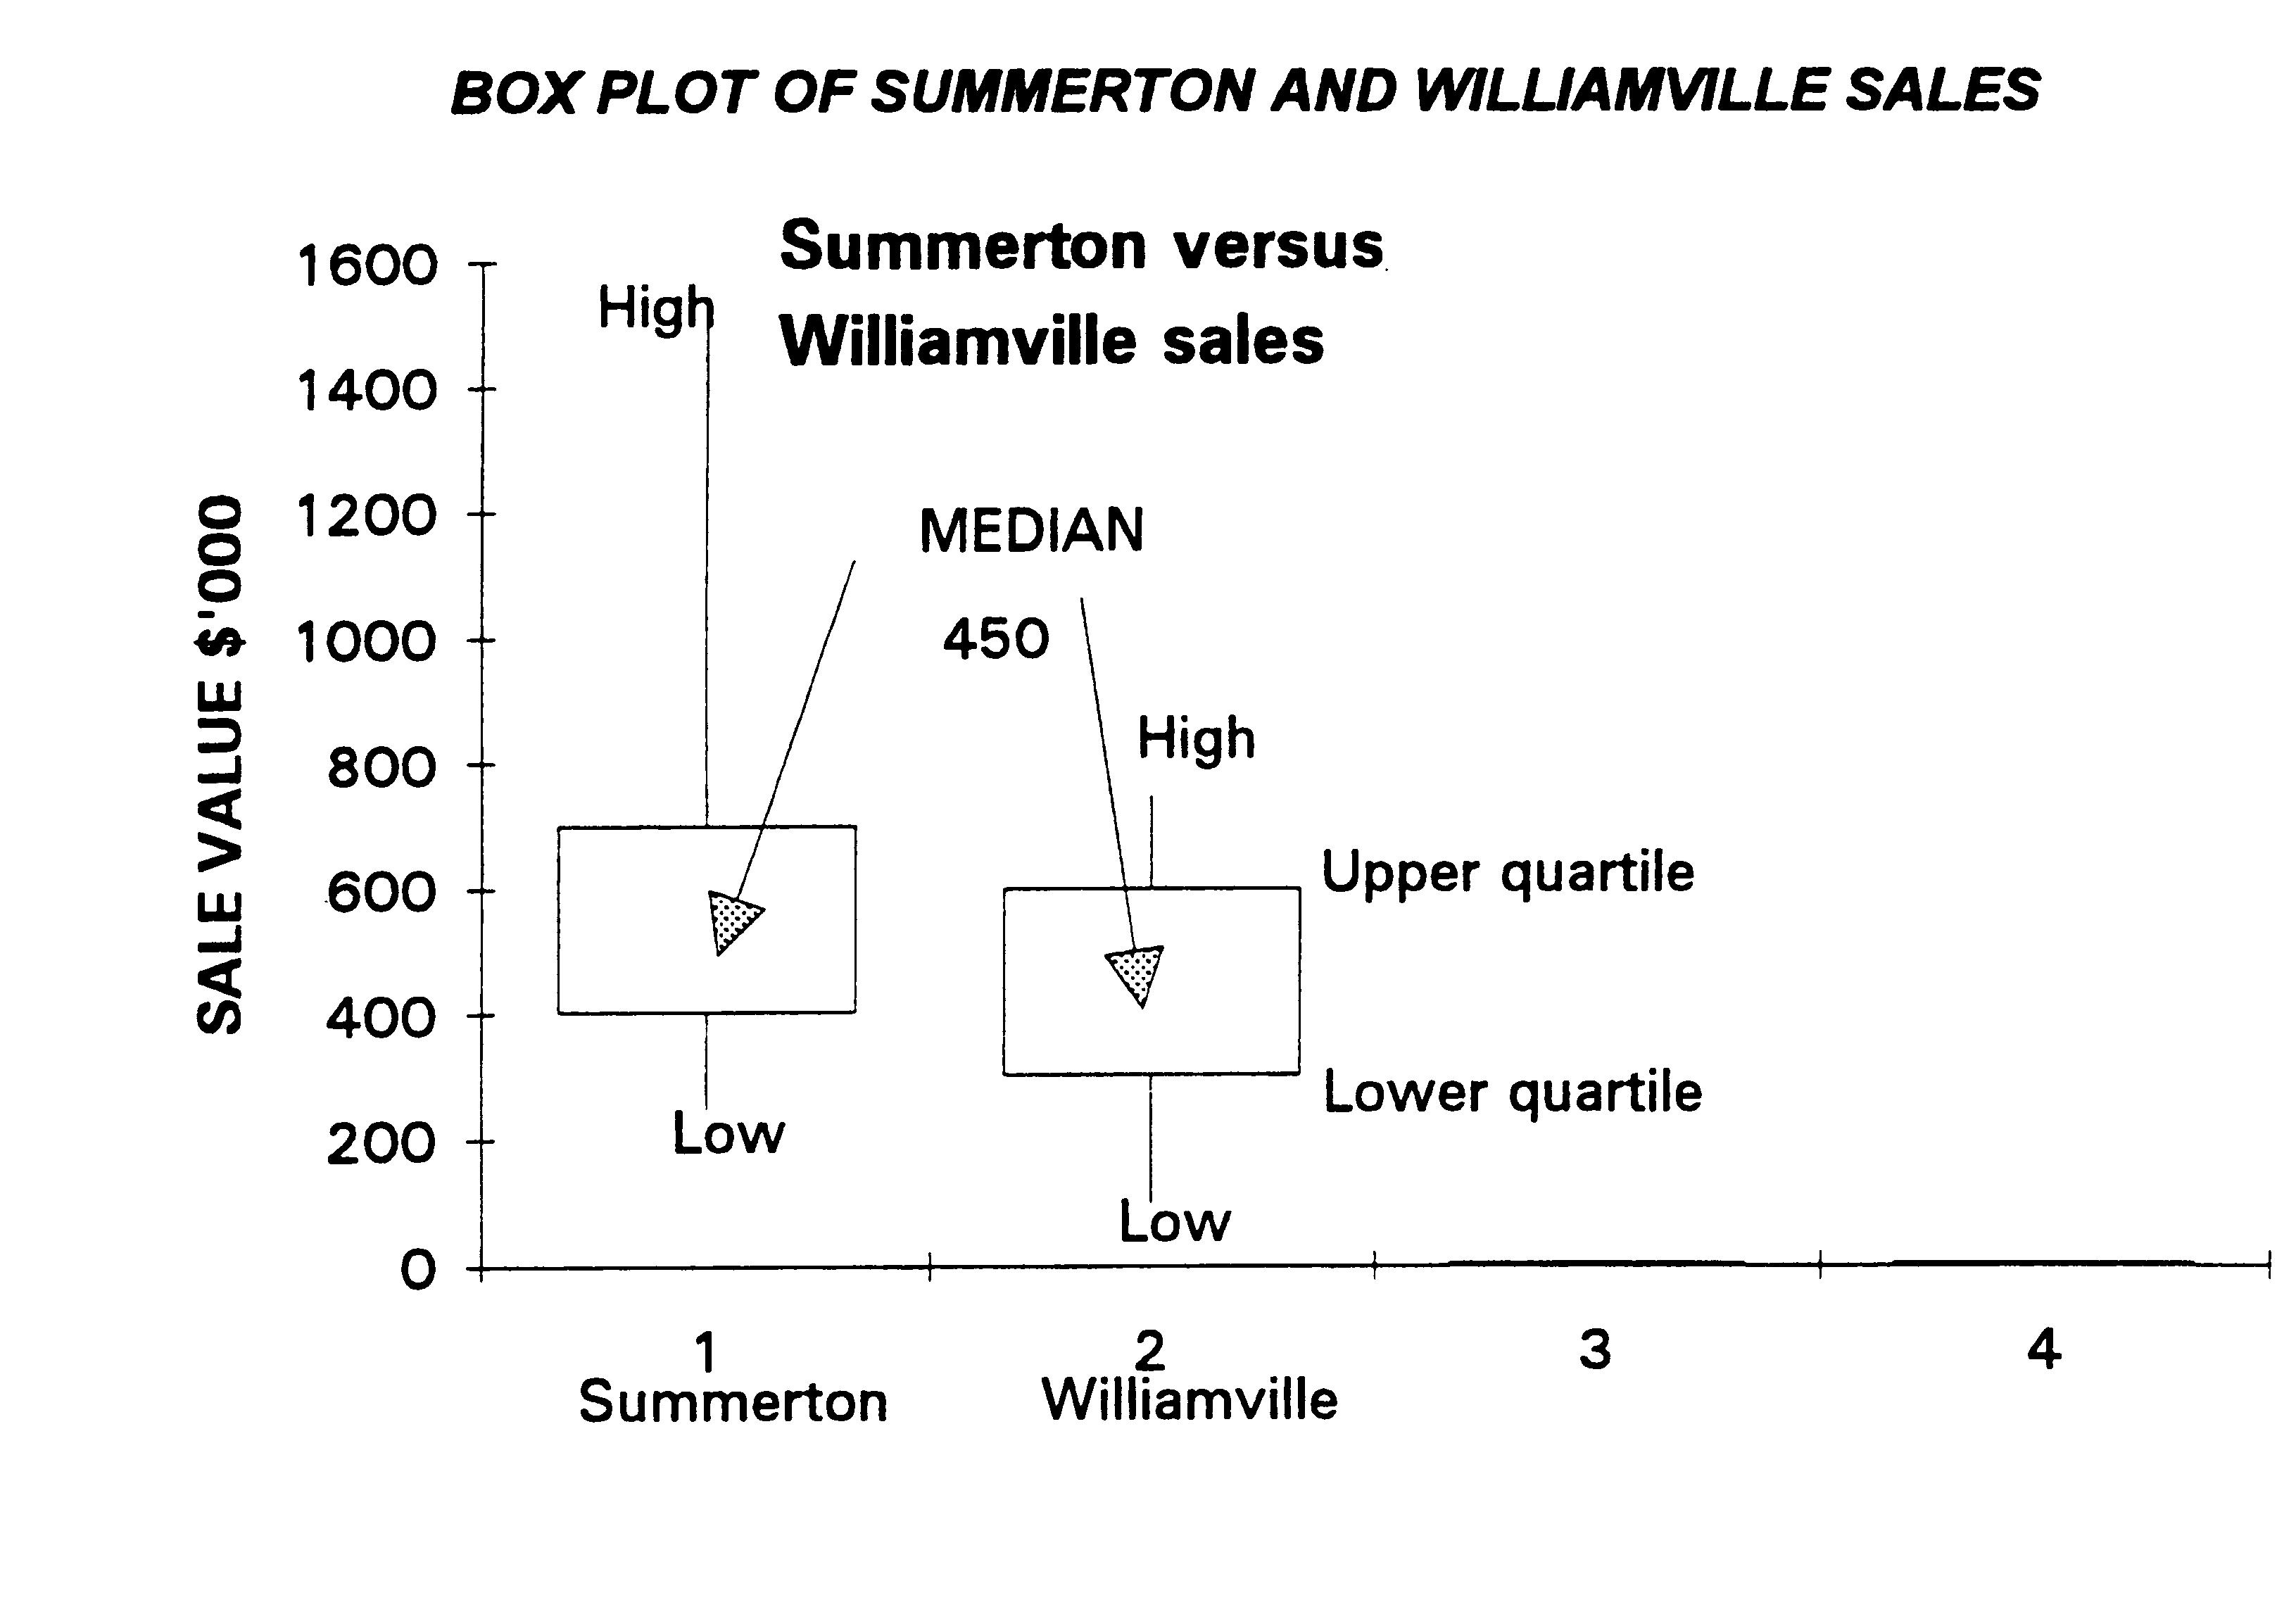
The BOX PLOT visually
summarises the measures of spread and simplifies comparison between the
2 sets of data. It also measures centrality by including the median:
BOX PLOT OF SUMMERTON AND WILLIAMVILLE SALES
The spread from the BOX PLOT is = value at top of box (quartile 3
value) - value at the bottom of the box (quartile 2 value):
For Summerton sales:
700-400 = 300
For Williamville
sales: 600-350 = 250